.png)
Turning Donor Data Chaos into Funding Intelligence
- Nova Data Analytics

- Mar 25
- 4 min read
Executive Summary
ThriveBridge NGO, a non-profit focused on education, health, and livelihood programmes, was sitting on years of donor records scattered across multiple spreadsheets, email inboxes, and disconnected systems. Despite receiving millions in annual funding, the organisation could not answer basic questions: Which donors were at risk of lapsing? Which programme funds were under-subscribed? When should they run their next campaign?
Nova designed and implemented a donor data management solution using SQL for data infrastructure and R for analysis and visualisation. The result: a fully transparent, reproducible view of every rand raised, and a strategic roadmap for retaining and growing their donor base.
The problem
NGOs and NPOs are mission-driven organisations. Their staff are skilled in programme delivery, advocacy, and community work, not data management. Yet donor funding is their lifeblood, and poor data hygiene creates compounding problems over time.
What ThriveBridge Experienced
• Donor records spread across Excel files maintained by three different staff members
• No consistent categorisation of donors by type, region, or funding programme
• Duplicate entries for several major donors, inflating reported donor counts
• Board reporting took 3–5 working days to compile from scratch each quarter
• No ability to identify which donors had lapsed or were at risk of disengagement
• Year-end fundraising campaigns were planned without any historical giving data
• Funders requesting impact-linked financial data could not be serviced efficiently
These are not unique problems. Across the NGO and NPO sector, data fragmentation is one of the top operational risks — yet it is rarely treated as a strategic priority until a major funder relationship is at stake.
The solution
Nova approached this engagement in three structured phases: data consolidation, analytical infrastructure, and insight delivery.
Phase 1 — Data Consolidation
All donor records were extracted, cleaned, and loaded into a unified relational database. A consistent schema was established with two core tables, Donors and Donations, linked by a unique donor identifier. Data quality rules were enforced at the point of entry to prevent future duplication and inconsistency. Check out an earlier case study where we detail how data auditing is important for deriving the correct insights from your data.
Phase 2 — SQL Analytical Infrastructure
A library of SQL queries was developed to power ongoing reporting and monitoring. Two examples are shown below.
Query 1: Identifying lapsed donors
-- Identify lapsed donors (no gift in 24+ months) SELECT d.donor_id, d.donor_name, d.donor_type, MAX(dn.donation_date) AS last_gift, ROUND(julianday('2025-01-01') - julianday(MAX(dn.donation_date))) AS days_since FROM donors d JOIN donations dn ON d.donor_id = dn.donor_id GROUP BY d.donor_id HAVING days_since > 730 ORDER BY days_since DESC; |
Query 2: Measuring year-over-year donor retention
-- Year-over-year donor retention rate WITH yearly_donors AS ( SELECT DISTINCT donor_id, year FROM donations ), retained AS ( SELECT a.year, COUNT(DISTINCT a.donor_id) AS retained FROM yearly_donors a JOIN yearly_donors b ON a.donor_id = b.donor_id AND b.year = a.year - 1 GROUP BY a.year ) SELECT r.year, r.retained, ROUND(r.retained*100.0/t.total,1) AS retention_pct FROM retained r JOIN (SELECT year, COUNT(DISTINCT donor_id) AS total FROM yearly_donors GROUP BY year) t ON t.year = r.year - 1; |
Phase 3 — R Analysis and Visualisations
Using R and the tidyverse ecosystem, Nova produced a suite of reproducible analytical reports. The five key visuals below were delivered to ThriveBridge leadership as part of a quarterly donor intelligence briefing.
Key Findings and Visualisation
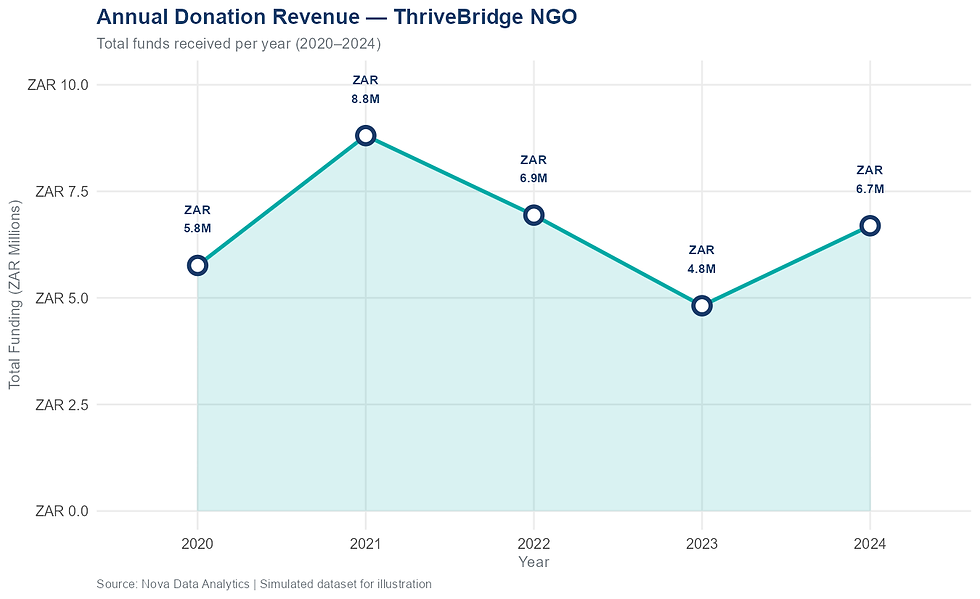
Finding 1 — Annual Funding Has Grown, But Inconsistently
Total annual donations grew from 2020 to 2024, but the organisation could not explain the dips because it had no visibility. With the dashboard, leadership can now see which years underperformed, link them to donor type activity, and plan correctly.
Finding 2 — Government Funders Drive the Majority of Revenue
Government grants account for the largest share of total funding, but they come from the smallest number of donors, making the organisation highly concentrated and vulnerable. Corporate and Foundation donors represent a significant growth opportunity.

Finding 3 — Programme Fund Allocation is Skewed Toward Health
The Health programme consistently attracts the most donor funding. This creates a resourcing imbalance.s Education and Livelihoods programmes are under-funded relative to community needs. The data allows leadership to make the case to funders for diversified programme investment.

Finding 4 — Donor Retention Drops Significantly After Year One
The cohort retention analysis revealed that the organisation typically retains fewer than half of new donors beyond their first year. This is a critical insight: acquiring new donors is expensive, and improving retention by even 10 percentage points would meaningfully increase annual revenue.

Finding 5 — November and December Drive a Predictable Giving Surge
Seasonality analysis confirmed a strong year-end giving pattern. November and December consistently produce the highest donation volumes. ThriveBridge can now plan targeted campaigns for this window with confidence, rather than running ad hoc appeals with no timing strategy.

Recommendations:
Consolidate all donor records into a single relational database immediately — the cost of fragmented data compounds every year.
Implement automated lapse alerts: a monthly SQL query can flag at-risk donors before they are lost.
Diversify your donor portfolio: if any single donor type exceeds 50% of revenue, you carry concentration risk.
Time your campaigns to data, not intuition: seasonality patterns in your own data are your best campaign planning tool.
Measure donor retention annually by cohort — it is the single most important indicator of organisational fundraising health.
Invest in reproducible reporting: R-based report templates mean your next board pack takes hours, not days.
About Nova Data Analytics
Nova Data Analytics is a South African data analytics firm specialising in helping organisations unlock the value of their data. We work with NGOs, NPOs, corporates, and government entities to design data strategies, build analytical infrastructure, and deliver insight that drives better decisions.
Our NGO and NPO practice is built on the understanding that mission-driven organisations deserve the same quality of data intelligence as the private sector, delivered at a cost and complexity that works for them.
Disclaimer: All data presented in this case study is simulated for illustrative purposes. ThriveBridge Foundation NGO is a fictional organisation created to demonstrate analytical methodology.

Comments